

Huge Update to Pasco SiteView!
 Nigel 26 Mar 2026 7 min read
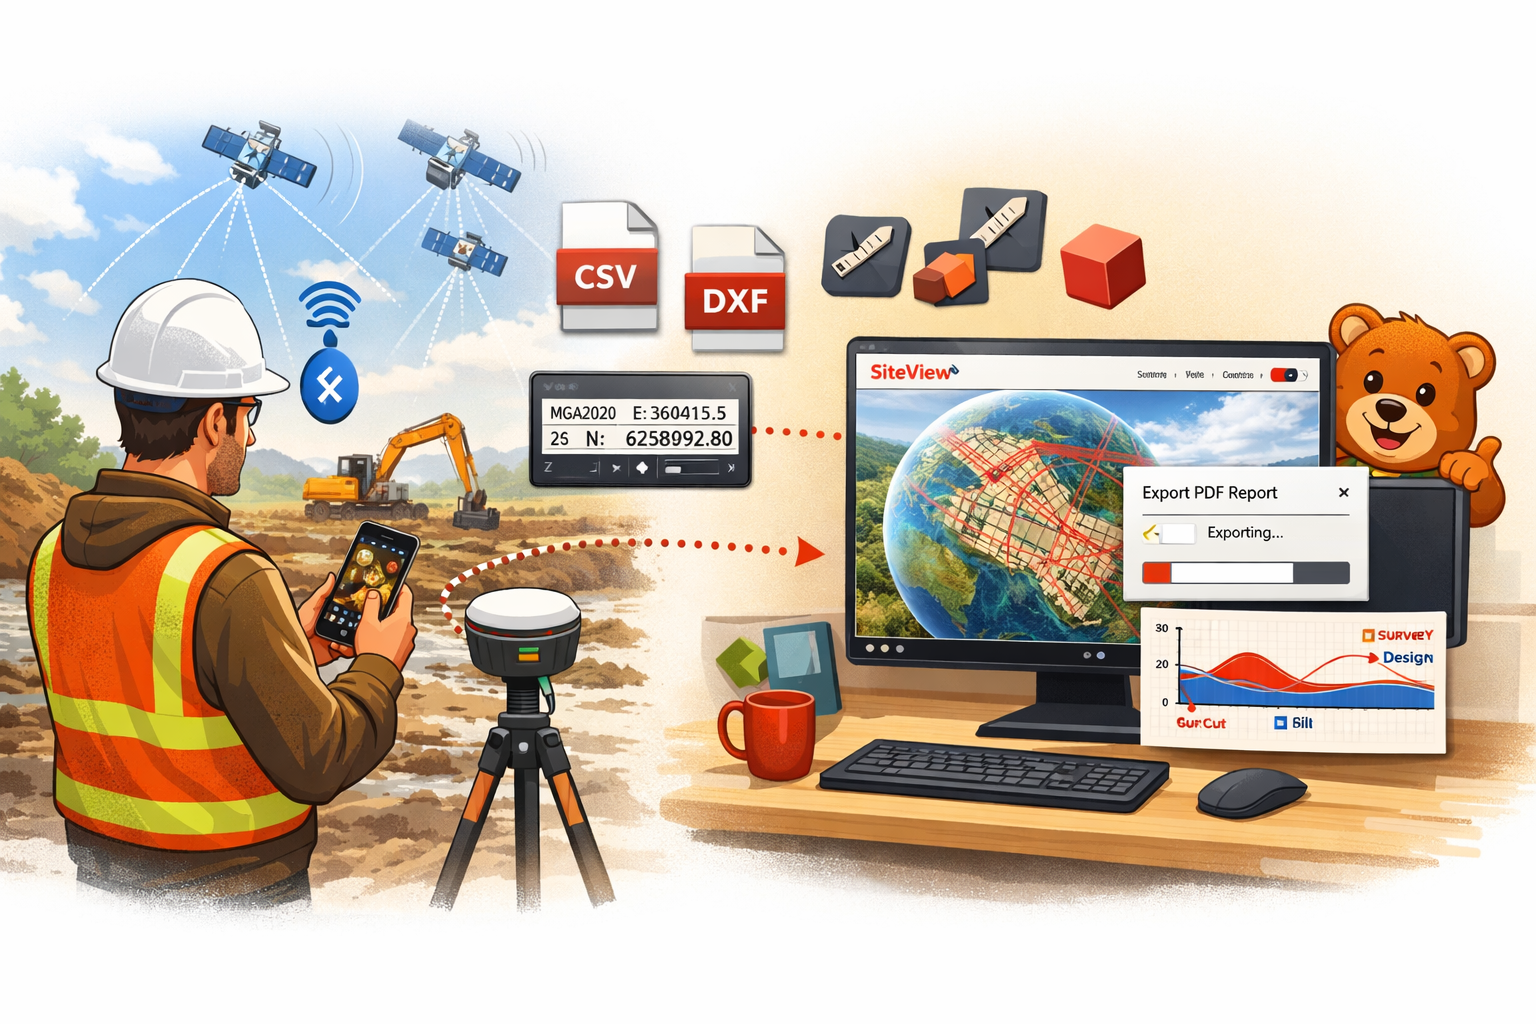
Pasco SiteView has just received its biggest update yet. We've added a huge amount of new capability across surveying, measurement, design comparison, and field data capture. If you haven't checked in on SiteView recently, now's the time.
Here's a rundown of everything that's new.
A Completely Redesigned Site Detail Experience
The site detail page has been rebuilt from the ground up. The CesiumJS 3D map now fills your entire screen, with a floating panel on the left side for tools and data. Five tabs — Overview, Surveys, Layers, Measurements, and Timeline — give you everything about the site without leaving the map context.
On mobile, the panel becomes a draggable bottom sheet that you can peek, half-expand, or pull to full height. It feels like a proper mapping app now, not a web page with a map bolted on.
Globe View Upgrades
The globe has had a serious polish pass. Site pins now cluster intelligently at low zoom and expand as you zoom in. Click a pin and you get a floating info card with site details and a "View Site" link — no more jarring page navigation. A collapsible side panel lets you search all your sites and fly to any one instantly.
We've added MapTiler Outdoor as a third base map option alongside Street and Satellite. Outdoor shows contour lines and terrain shading — genuinely useful for earthworks sites where understanding the topography matters before you even fly the drone.
10 Measurement Tools
 This is the big one. SiteView now has ten precision measurement tools, all accessible from the Measurements tab with single-key shortcuts:
- Distance (D) — per-segment 3D distance, bearing, gradient, and elevation change
- Area (A) — spherical polygon area
- Volume (V) — cut/fill against four reference modes plus compare-to-design
- Elevation Profile (E) — interactive SVG chart with hover sync to the globe
- Gradient (G) — two-point slope with colour coding (green/amber/red by steepness)
- Coordinate (C) — single-click readout in WGS84, DMS, MGA2020, or NZTM2000 with copy buttons
- Height (H) — focused vertical distance between two points
- Arc (R) — define by centre+radius or pick three points on a curve
- Grade Check (K) — multi-point survey vs design comparison with configurable tolerance
- Cross-Section (X) — dual SVG chart showing survey and design profiles with cut/fill shading
Every measurement can now be saved with a category (freeform with autocomplete — "Setting Out", "As-Built Check", whatever your team uses), notes, and up to five photos. Categories make it easy to find measurements later — "show me all the QA hold point checks from last week."
Design Surface Overlays
You can now import design files directly from your CAD software and overlay them on the map.
DXF files from AutoCAD, Civil3D, or 12d are parsed with support for 10+ entity types. Coordinate system auto-detection handles MGA2020 zones 49–56 and NZTM2000 automatically — upload a DXF from your designer and it lands in the right place on the globe.
KML/KMZ files from Google Earth retain their original styles — line colours, polygon fills, descriptions, and nested folder structures all preserved.
Each layer gets independent visibility, colour, and opacity controls. Load multiple design surfaces at once to compare revisions side by side.
Design Comparison — The Daily Use Feature
This is where things get really practical. With a survey DEM and a design surface loaded, you can now:
Compare to Design Volume — draw a polygon and get a true cut/fill breakdown. Red for cut, blue for fill.
Grade Check — click points across your site and see survey RL vs design RL at each point. Green for pass, amber for marginal, red for fail. Set tolerances from ±20mm (concrete slabs) to ±100mm (bulk earthworks).
Cross-Section vs Design — see both profiles overlaid at any point with cut/fill area shading.
Cut/Fill Heat Map — a colour-coded raster overlay showing cut and fill distribution across your entire site. Generated server-side and displayed as a toggleable map layer.
Road Alignment Conformance
For road and rail projects, SiteView now imports LandXML alignment files — the standard format from 12d, Civil3D, and OpenRoads. The parser handles straights, circular curves, and clothoid spiral transitions with full mathematical precision.
Alignments render with chainage markers at configurable intervals. Hover to see chainage, design elevation, and grade at any point. Generate cross-sections at any chainage perpendicular to the alignment, and run conformance checks comparing survey vs design at the centreline and at offset distances — results in a colour-coded table where you can click any cell to fly to that location.
DXF polylines can also be used as simplified alignments if LandXML isn't available.
Pre-Processed Data Import
SiteView no longer requires NodeODM to be useful. You can now import pre-processed data from Pix4D, DroneDeploy, Agisoft Metashape, or any tool that outputs standard formats:
- Orthophoto GeoTIFF → automatically tiled for map overlay
- DEM/DSM GeoTIFF → ready for all measurement tools
- Point cloud LAS/LAZ → converted to 3D Tiles for CesiumJS viewing
Upload one, two, or all three — SiteView handles the processing with progress updates and creates a completed survey with all layers available immediately.
RTK Integration
SiteView now integrates with RTK GNSS receivers for centimetre-level accuracy.
On mobile (Pasco SiteView app for Android), connect to an ArduSimple or SparkFun RTK receiver via Bluetooth. The app handles NTRIP correction streaming, NMEA parsing, and fix status display. Capture survey points from the field — they sync to the cloud and appear on the web globe.
In the browser (Chrome), connect via Web Bluetooth for the same RTK precision on a laptop or tablet in the field. Pre-configured QGPSnet profile for Queensland included.
Points captured via RTK show accuracy badges on the web — you can immediately see which measurements were captured at ±10mm vs ±3m phone GPS.
The Measurements Page
A new dedicated page at /measurements with four tabs:
Register — all measurements across all sites in a filterable, sortable, paginated table.
Calculator — manual coordinate entry with point-to-point, radial, and traverse modes. Enter coordinates in any format, calculate distances and bearings without touching the map.
Import — upload CSV coordinate files from total stations or RTK rovers. Auto-detects whether the coordinates are WGS84 or MGA2020/NZTM2000.
Converter — real-time conversion between WGS84, DMS, MGA2020 (all zones), and NZTM2000. Single point and batch modes.
Export to PDF, CSV, and DXF
All measurements now export in three formats:
PDF — branded reports with Pasco styling, site header, measurement tables, and per-type detail sections.
CSV — with configurable coordinate columns (WGS84, grid, or both). Includes category and notes.
DXF — measurement geometry on named layers in grid coordinates. Opens directly in AutoCAD for integration with existing CAD workflows.
Full Australia and New Zealand Coverage
We've extended coordinate support to cover all of Australia (MGA2020 zones 49–56) and all of New Zealand (NZTM2000). Auto-detection works from longitude for geographic coordinates and from value ranges for grid coordinates in CSV imports and DXF files. Set your preferred format in Settings and every tool uses it.
Surveys Page and Settings
Two former placeholder pages are now fully functional.
The Surveys page shows all surveys across all sites with status tabs, filters, search, and pagination — a central view of your survey pipeline.
The Settings page lets you configure map defaults, coordinate preferences (default format and zone), measurement defaults (grade check tolerance, volume reference mode), NodeODM connection, and theme.
What Didn't Change
All the existing functionality still works exactly as before. Site management, project linking, survey uploads, and NodeODM processing are all untouched. This update adds capability without changing anything you're already using.
Try It Out
Head to siteview.pasco.cloud and log in with your Pasco Cloud account. Everything in this update is live now.
Got feedback or feature requests? We'd love to hear from you — reach out via the contact form or check out the full SiteView documentation.